How Tracing Works
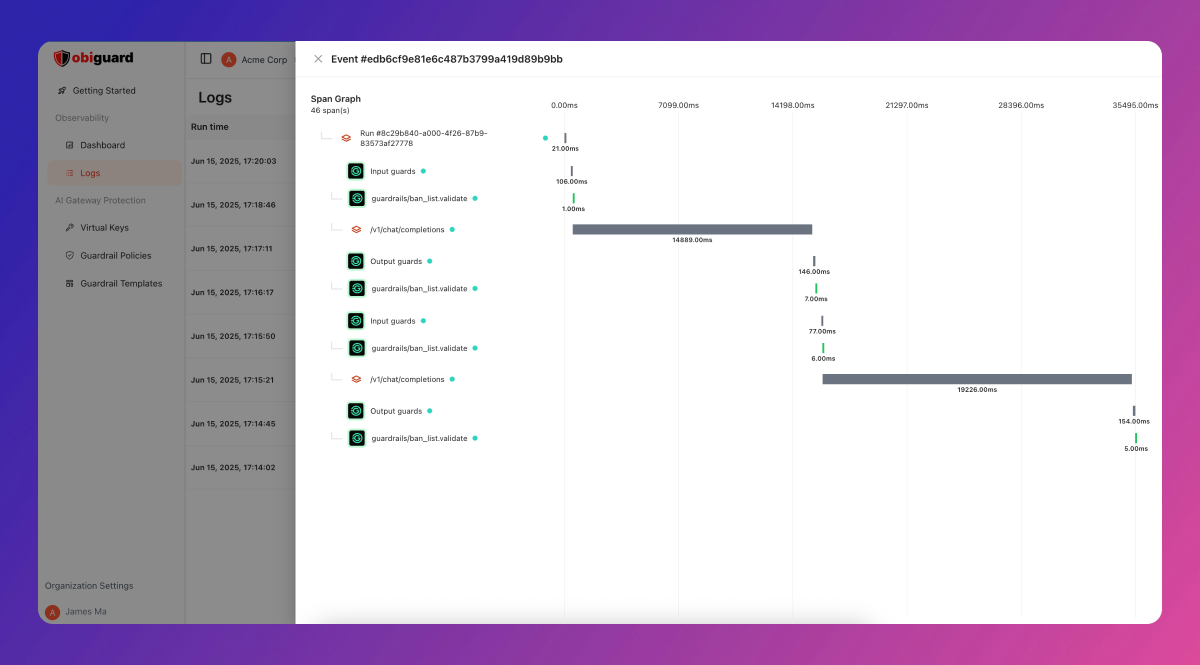
Obiguard uses OpenTelemetry-compliant tracing to monitor your LLM requests. By attaching a trace ID to your requests, all related LLM calls are automatically grouped in the Traces View and displayed as “spans” within a trace. A “span” represents a subgroup of LLM calls. Depending on your instrumentation, a span can refer to a group within a trace or a single LLM call.Trace Tree Structure
Obiguard implements tracing using a tree-like structure, similar to OpenTelemetry. Each node in this tree is a span, identified by a uniquespanId and an optional spanName. Child spans reference their parent using parentSpanId. Spans without a parent become root nodes.
| Key | Node | Key - Python | Expected Value | Required? |
|---|---|---|---|---|
| traceId | trace_id | Unique string | YES | |
| spanId | span_id | Unique string | NO | |
| spanName | span_name | string | NO | |
| parentSpanId | parent_span_id | Unique string | NO |
Benefits of Tracing
- Cost Analysis: Monitor total LLM costs for each trace.
- Debugging: Quickly review all related requests in a trace and spot issues.
- Performance Monitoring: Gain visibility into the full request lifecycle and overall trace timing.