Charts
The dashboard delivers detailed insights into users, errors, cache activity, feedback, and aggregates data by metadata.Overview
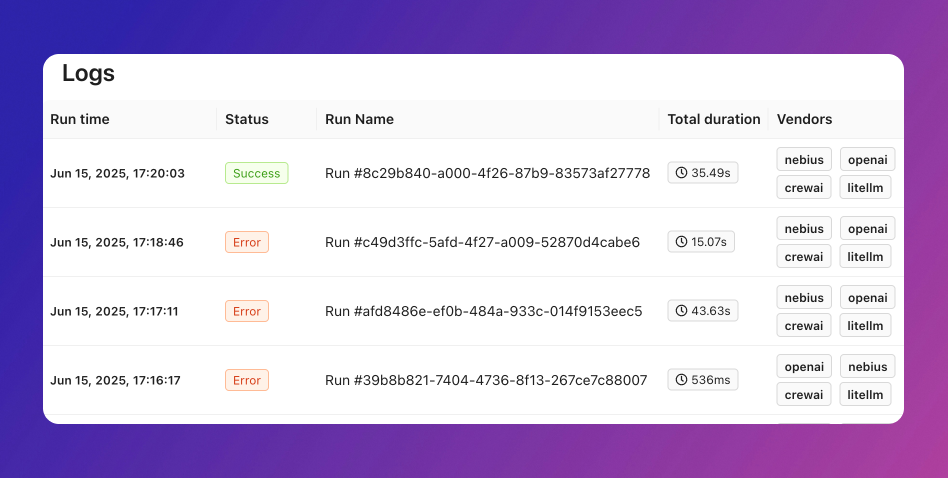
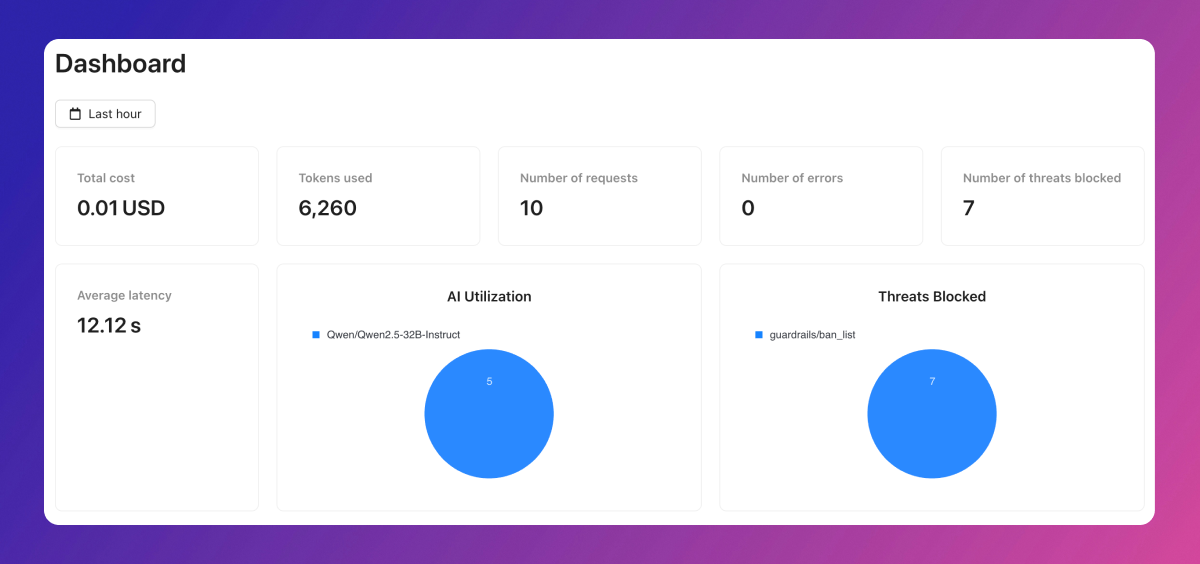
The overview tab provides a high-level summary of your application’s performance, highlighting total cost, tokens consumed, average latency, request volume, and key information about users and top models. Start here to get a broad understanding before exploring specific metrics.Errors
Obiguard automatically tracks both API and accuracy errors. The error charts provide a quick overview of error rates, helping you identify and troubleshoot issues efficiently. You can also see how many requests were recovered by Obiguard using various AI gateway strategies.